From journey map to causal loop diagram
Links, polarity and feedback
Converting the map into a causal loop diagram, finding the reinforcing and balancing loops, and locating the leverage points.
From journey map to variables
A journey map is made of steps, people and things that happened. A causal loop diagram is made of variables. So the conversion starts with a rewrite into the only grammar a causal loop diagram understands: a quantity that can rise or fall.
"Long waiting time for an assessment" is a variable. "The assessment team" is not. "Staff morale" can be a variable. "Staff" cannot. Expect to rewrite most steps at least once, and expect some of them to leave the diagram.
Two rules keep the rewrite honest. First, name the quantity, not the problem. "Frequency of missed appointments" beats "appointment problems", because you can say whether it went up or down. Second, keep each variable close to what the workshop recorded. A variable lifted from a framework rather than a touch point is a claim, not a finding.
Naming variables from the touch points
Each emotional touch point usually implies one or more variables. A carer who described chasing a letter three times implies "number of times the carer has to chase information". A clinician who said the clinic was always full implies "demand for appointments relative to capacity". Where the material is thin, keep the variable and mark the link as weak. Do not drop it silently, and do not dress it up.
Links and polarity
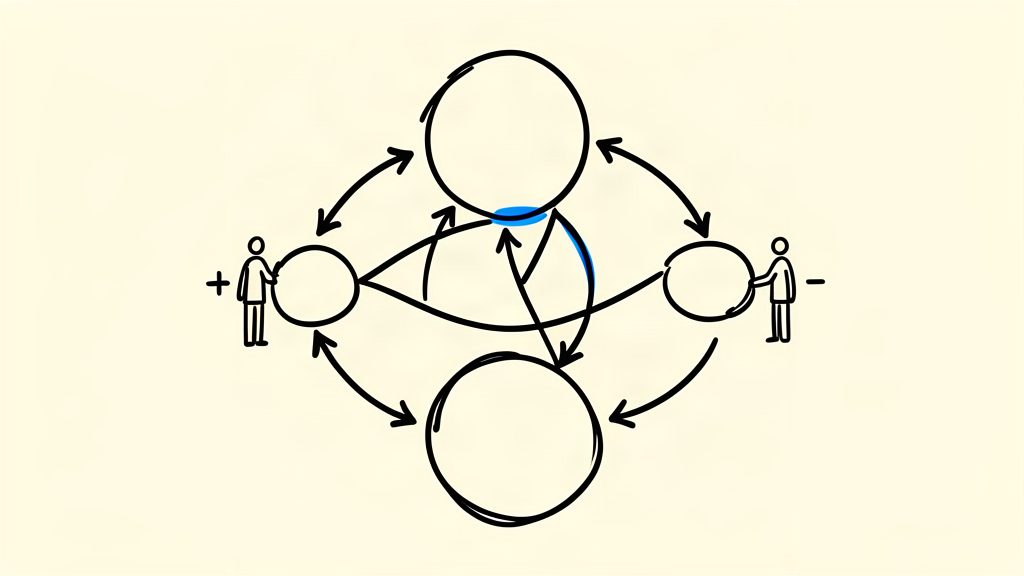
A link says that one variable affects another. Every link carries a polarity mark. The guidance sets out the convention in two lines.
- Positive (+), or same direction. An increase in the first variable leads to an increase in the second, or a decrease leads to a decrease.
- Negative (-), or opposite direction. An increase in the first variable leads to a decrease in the second, or the reverse.
Polarity is a claim about direction only. It says nothing about the size of the effect, how quickly it arrives, or whether it holds for everyone. Two links with the same sign can differ by an order of magnitude and the diagram will look identical.
Delays
Many causal effects in a service do not arrive immediately, and the guidance marks these links with a delay tick. The mark records that the effect takes time. It does not record how much time, or the shape of the lag. That limit matters. A delay is often the reason a service that is working looks like it is failing: the activity is happening and the outcome has not arrived yet. Treat every delay mark as a question for the team, not as an answer.
Reinforcing and balancing loops
Follow the links until you arrive back where you started, and you have a feedback loop. There are two kinds, and the guidance gives a counting rule for telling them apart.
- Reinforcing loop (R). The loop reinvests change as further change in the same direction. An even number of negative links makes a loop reinforcing.
- Balancing loop (B). The loop resists change and holds the status quo. An odd number of negative links makes a loop balancing.
The counting rule is a check, not a substitute for reading the loop out loud. The guidance works its own example the same way: quality of care rises, attendance rises, workload rises, staff motivation falls, and quality of care falls again. The initial improvement cancels itself out. That is a balancing loop, and it is exactly the structure that defeats a single-service improvement.
Name each loop after its main variable, and label it R or B with a number. A loop with no name is a loop nobody will discuss. Some diagrams are built around a small set of core loops, which the guidance calls a system engine. Others are fluid, with no obvious centre.
Finding the most connected variables
Count the links on each variable and rank them. The count is a fact about the diagram, and it can be done by hand. Then read what the top variables connect. A variable that sits on several loops does more work than one that sits on none.
The guidance flags two special cases worth looking for. A sink takes influence and passes none on. A driver influences the problem without being influenced by it. Both are useful to know about, and neither is a leverage point in the usual sense. The guidance is also clear that there is no gold standard method for locating leverage points. Reading the loops, network analysis and stakeholder judgement are all in use, and they can disagree. Say which one you used.
What the diagram cannot tell you
Three further limits are constant. The diagram carries no people, no money and no time, so cost, staffing and feasibility all sit outside it. It flattens distribution, because a change lands differently on different groups and the diagram will not show that. And it is bounded, because a boundary was chosen. Whatever the boundary excluded is invisible here, however important it turns out to be.
Last, a map describes structure, not effect. It can show that a loop is likely to sustain a problem. It cannot tell you how large a change would be, or whether the intervention you are considering will work.